This independent website hosts the Supplementary Information associated with a Letter to the Editor accepted for publication in World Psychiatry. The Supplement is displayed in its entirety on this page, and is also available for download:
Download Supplementary Information (.pdf)
also available as .docx here
Supplementary Information
Trauma attenuates the association between schizophrenia polygenic risk and psychosis spectrum classification in a developmental cohort
Tyler M. Moore, Laura M. Schultz, Monica E. Calkins, Kosha Ruparel, Ruben C. Gur, Laura Almasy, Raquel E. Gur
Letter to the Editor, World Psychiatry
This supplement contains the visualization of the primary polygenic risk score for schizophrenia (PRS-SCZ) x trauma interaction in the European-ancestry (EUR) sample (Figure S1), and parallel analyses conducted in the African-ancestry (AFR) subsample of the Philadelphia Neurodevelopmental Cohort (PNC), including descriptive statistics (Table S1), logistic regression results (Table S2), and the corresponding interaction visualization (Figure S2).
All analytic procedures were identical to those described in the Letter. PRS-SCZ for the AFR subsample were computed using AFR-specific GWAS summary statistics from Trubetskoy et al (2022) and residualized on 10 within-ancestry principal components. As in the main analyses, participants ages 8-10 were excluded because clinical symptom data for these participants were collected via caregiver report only.
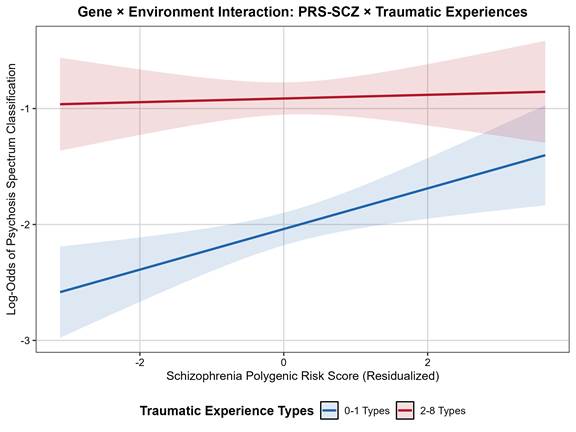
Figure S1. Relationship between schizophrenia polygenic risk score and log-odds of psychosis spectrum classification, by trauma exposure group, in the European-ancestry sample (ages 11-21; n=3,905). Shaded regions represent 95% confidence intervals. Among low-trauma youth (0-1 types), higher PRS-SCZ is associated with increased log-odds of psychosis spectrum classification (positive slope); among high-trauma youth (2-8 types), this association is attenuated to near-zero, with overall log-odds of psychosis spectrum classification elevated regardless of polygenic loading, consistent with the significant PRS-SCZ x trauma interaction (p=0.037).
The AFR subsample included 2,396 participants – 845 psychosis spectrum (PS), 1,549 non-PS; 35.3% PS. Compared to the EUR sample (19.9% PS), the AFR subsample had a notably higher base rate of PS classification. As shown in Table S1, PS participants were significantly younger than non-PS participants (t=−6.01, p<0.001) and reported significantly more types of traumatic experiences (mean = 1.68 vs. 1.11; t=8.87, p<0.001). Neighborhood socioeconomic status (SES) did not significantly differ between groups (t=−1.75, p=0.081). PRS-SCZ did not differ between PS and non-PS groups (t=−0.74, p=0.458), and sex was not significantly associated with PS classification (χ²=2.81, p=0.094).
Table S1
Demographic and clinical characteristics of the African-ancestry subsample by psychosis spectrum classification
| Variable | Full sample | PS | Non-PS | Statistic | p |
| N | 2,396 | 845 | 1,549 | ||
| Age (years) | 15.89 (2.76) | 15.43 (2.75) | 16.14 (2.74) | t=−6.01 | <0.001 |
| envSES | −1.02 (0.78) | −1.06 (0.74) | −1.00 (0.79) | t=−1.75 | 0.081 |
| PRS-SCZ | −0.01 (0.87) | −0.03 (0.86) | −0.00 (0.87) | t=−0.74 | 0.458 |
| Trauma types | 1.31 (1.45) | 1.68 (1.58) | 1.11 (1.33) | t=8.87 | <0.001 |
| Sex (% male) | 43.4% | 45.8% | 42.2% | χ²=2.81 | 0.094 |
Values are means (SD) unless otherwise noted. PS = psychosis spectrum; envSES = neighborhood socioeconomic status factor score; PRS-SCZ = polygenic risk score for schizophrenia (residualized on ancestry principal components). Sample restricted to ages 11–21.
As shown in Table S2, cumulative traumatic experiences were the strongest predictor of PS classification in the AFR subsample (beta=0.35, SE=0.03, z=10.71, p<0.001, OR=1.41), with a 41% increase in the odds of PS per additional trauma type. Younger age was also significantly associated with PS (beta=−0.15, z=−8.55, p<0.001), with the odds of PS decreasing by 14% for each additional year of age. Neither PRS-SCZ (beta=−0.04, z=−0.70, p=0.485), neighborhood SES (beta=−0.06, z=−1.02, p=0.308), nor sex (beta=−0.04, z=−0.42, p=0.674) was significantly associated with PS status. Critically, the PRS-SCZ x trauma interaction was not significant (beta=0.01, z=0.14, p=0.889), indicating no evidence of gene–environment interaction in the AFR subsample.
Table S2
Logistic regression results predicting psychosis spectrum classification in the African-ancestry subsample
| Predictor | B | SE | z | p | OR [95% CI] |
| Intercept | 1.25 | 0.29 | 4.26 | <0.001 | — |
| PRS-SCZ | −0.04 | 0.05 | −0.70 | 0.485 | 0.96 [0.87, 1.07] |
| Trauma types | 0.35 | 0.03 | 10.71 | <0.001 | 1.41 [1.33, 1.50] |
| envSES | −0.06 | 0.06 | −1.02 | 0.308 | 0.94 [0.84, 1.06] |
| Sex (female) | −0.04 | 0.09 | −0.42 | 0.674 | 0.96 [0.81, 1.15] |
| Age | −0.15 | 0.02 | −8.55 | <0.001 | 0.86 [0.83, 0.89] |
| PRS-SCZ × Trauma | 0.01 | 0.04 | 0.14 | 0.889 | 1.01 [0.94, 1.08] |
Main effects are from the additive model (without the interaction term). The interaction term is from the full model including the product term. OR = odds ratio; CI = confidence interval; PRS-SCZ = polygenic risk score for schizophrenia; envSES = neighborhood socioeconomic status.
The nonsignificant main effect of PRS-SCZ in the AFR subsample – alongside the absence of a PRS-SCZ x trauma interaction – contrasts with the EUR results, in which PRS-SCZ was significantly positively associated with PS and showed a significant negative interaction with trauma. The direction of the PRS-SCZ main effect in the AFR sample was unexpectedly negative (though nonsignificant), which is difficult to interpret substantively and likely reflects the limited predictive power of current AFR-derived PRS. AFR GWAS discovery samples remain substantially smaller than their EUR counterparts, resulting in PRS that capture less of the heritable liability for schizophrenia. The higher base rate of PS in the AFR subsample (35.3% vs. 19.9% in EUR) may also reflect greater overall environmental adversity in this group (mean envSES = −1.02 vs. 0.62 in EUR), consistent with research documenting elevated trauma exposure and neighborhood-level disadvantage among African American youth. In such a context, the contribution of common genetic variation to PS classification may be further diminished, paralleling the pattern observed in the EUR high-trauma stratum.
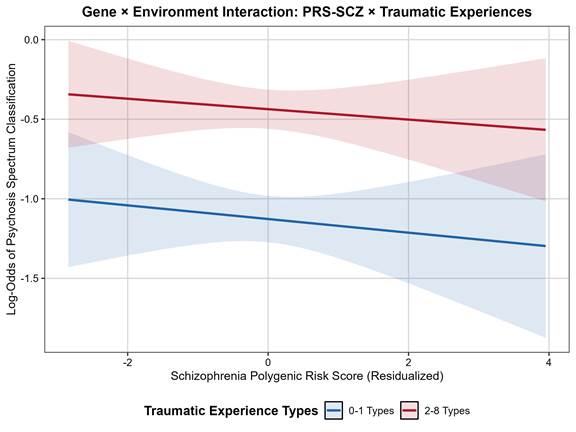
Figure S2. Relationship between schizophrenia polygenic risk score and log-odds of psychosis spectrum classification, by trauma exposure group, in the African-ancestry subsample (ages 11-21; N=2,396). Shaded regions represent 95% confidence intervals. Unlike the EUR sample (Figure S1), both trauma groups show similar, near-zero slopes for PRS-SCZ, and the confidence intervals are wide and largely overlapping, consistent with the nonsignificant interaction (p=0.889).